Navigation
Click on the Analytics link in the main navigation bar.
Description
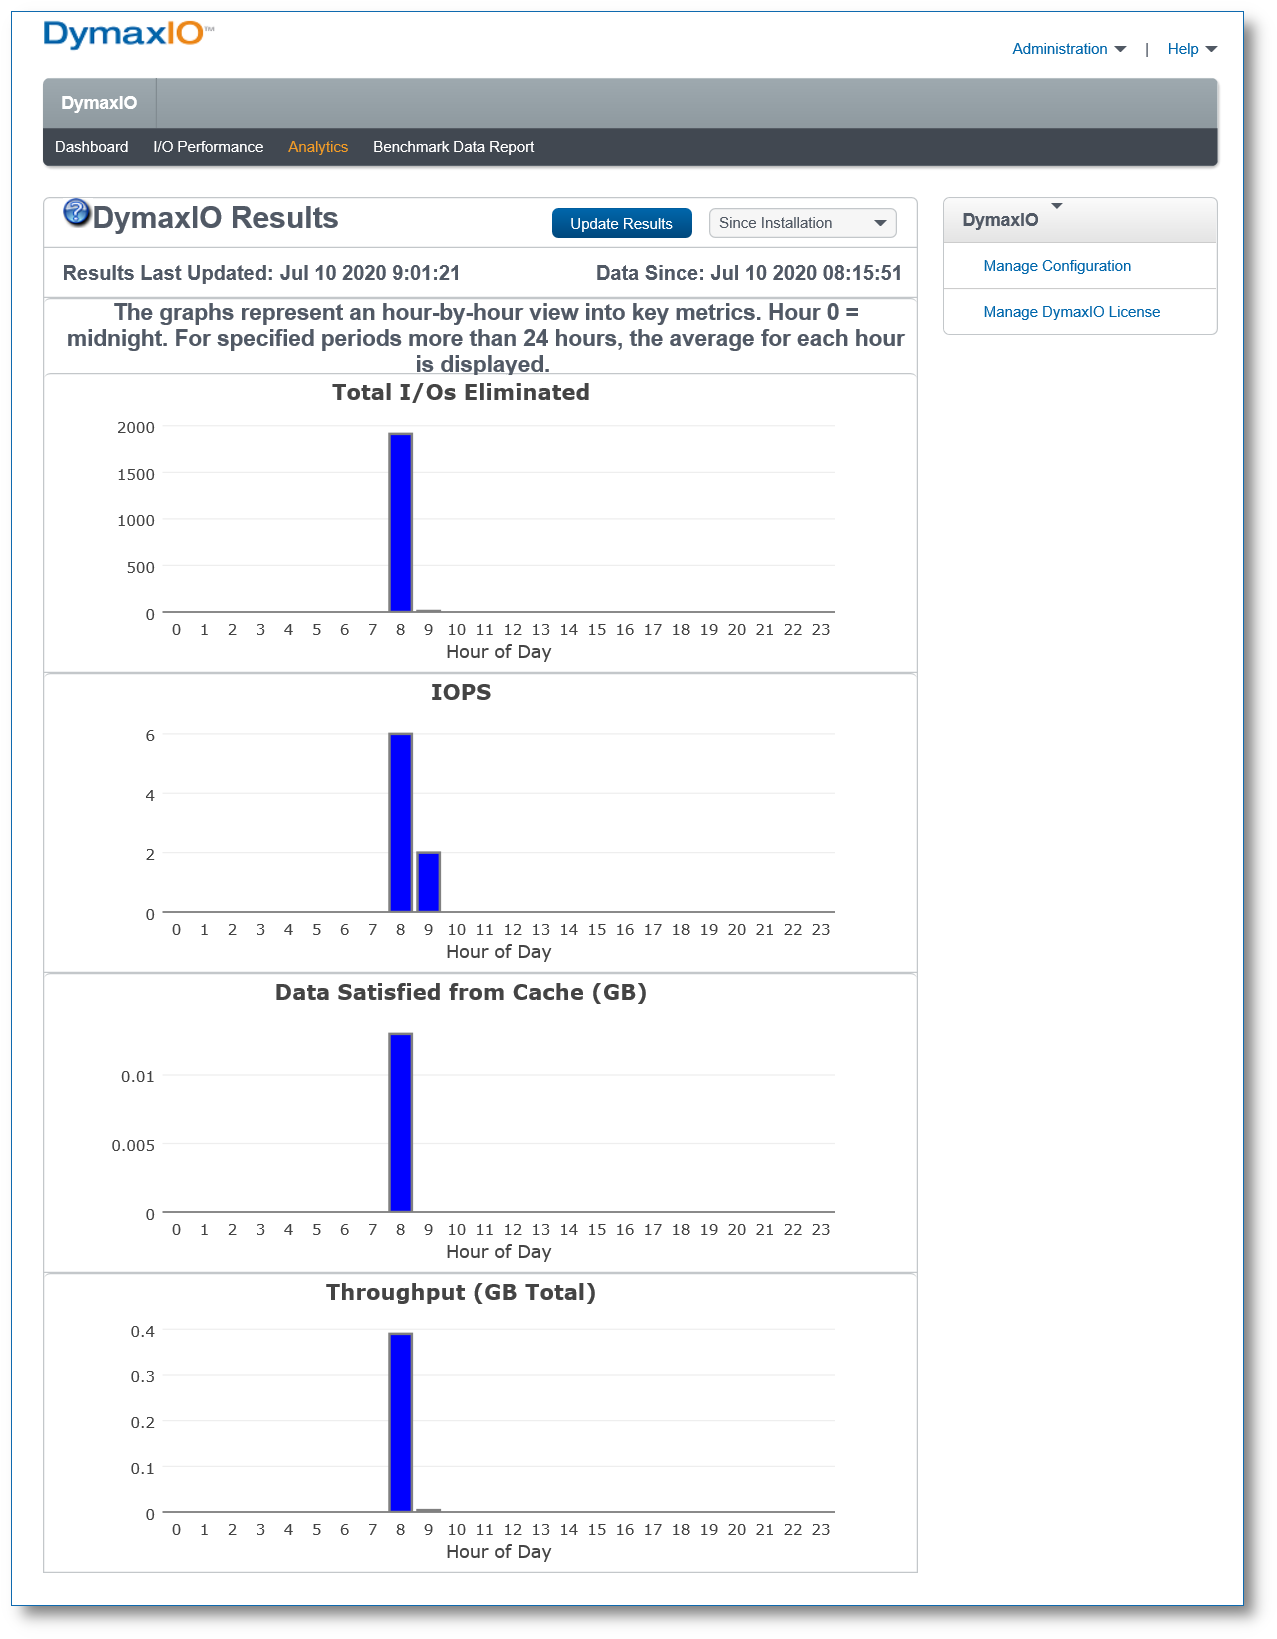
The Analytics link displays performance metrics in graphical form that provide the user an hour by hour view of system performance. This can be very helpful to identify I/O patterns by time of day, over the specified time frame.
For selected time frames more than 24 hours, the average for each hour is displayed.
Metrics shown in graphical form include:
Total I/Os Eliminated
I/Os Per Second (IOPS)
Data Satisfied from Cache (GB)
Throughput (GB Total)
Throughput (MB/Sec)
I/O Time Saved (seconds)
Read I/Os Eliminated
Percent of Read I/Os Eliminated
Write I/Os Eliminated
Percent of Write I/Os Eliminated
Fragments Prevented and Eliminated
I/O Response Time
Read to Write Percentage
Clicking on the information icon in the DymaxIO Results title bar will bring up this Help topic for the Analytics.performance metrics.
The Product Alerts section, DymaxIO Status section, and DymaxIO Quick Links pull-down menu are visible in this screen, and the Dashboard and I/O Performance screens.