Navigation
Click on the I/O Performance link in the main navigation bar.
Description
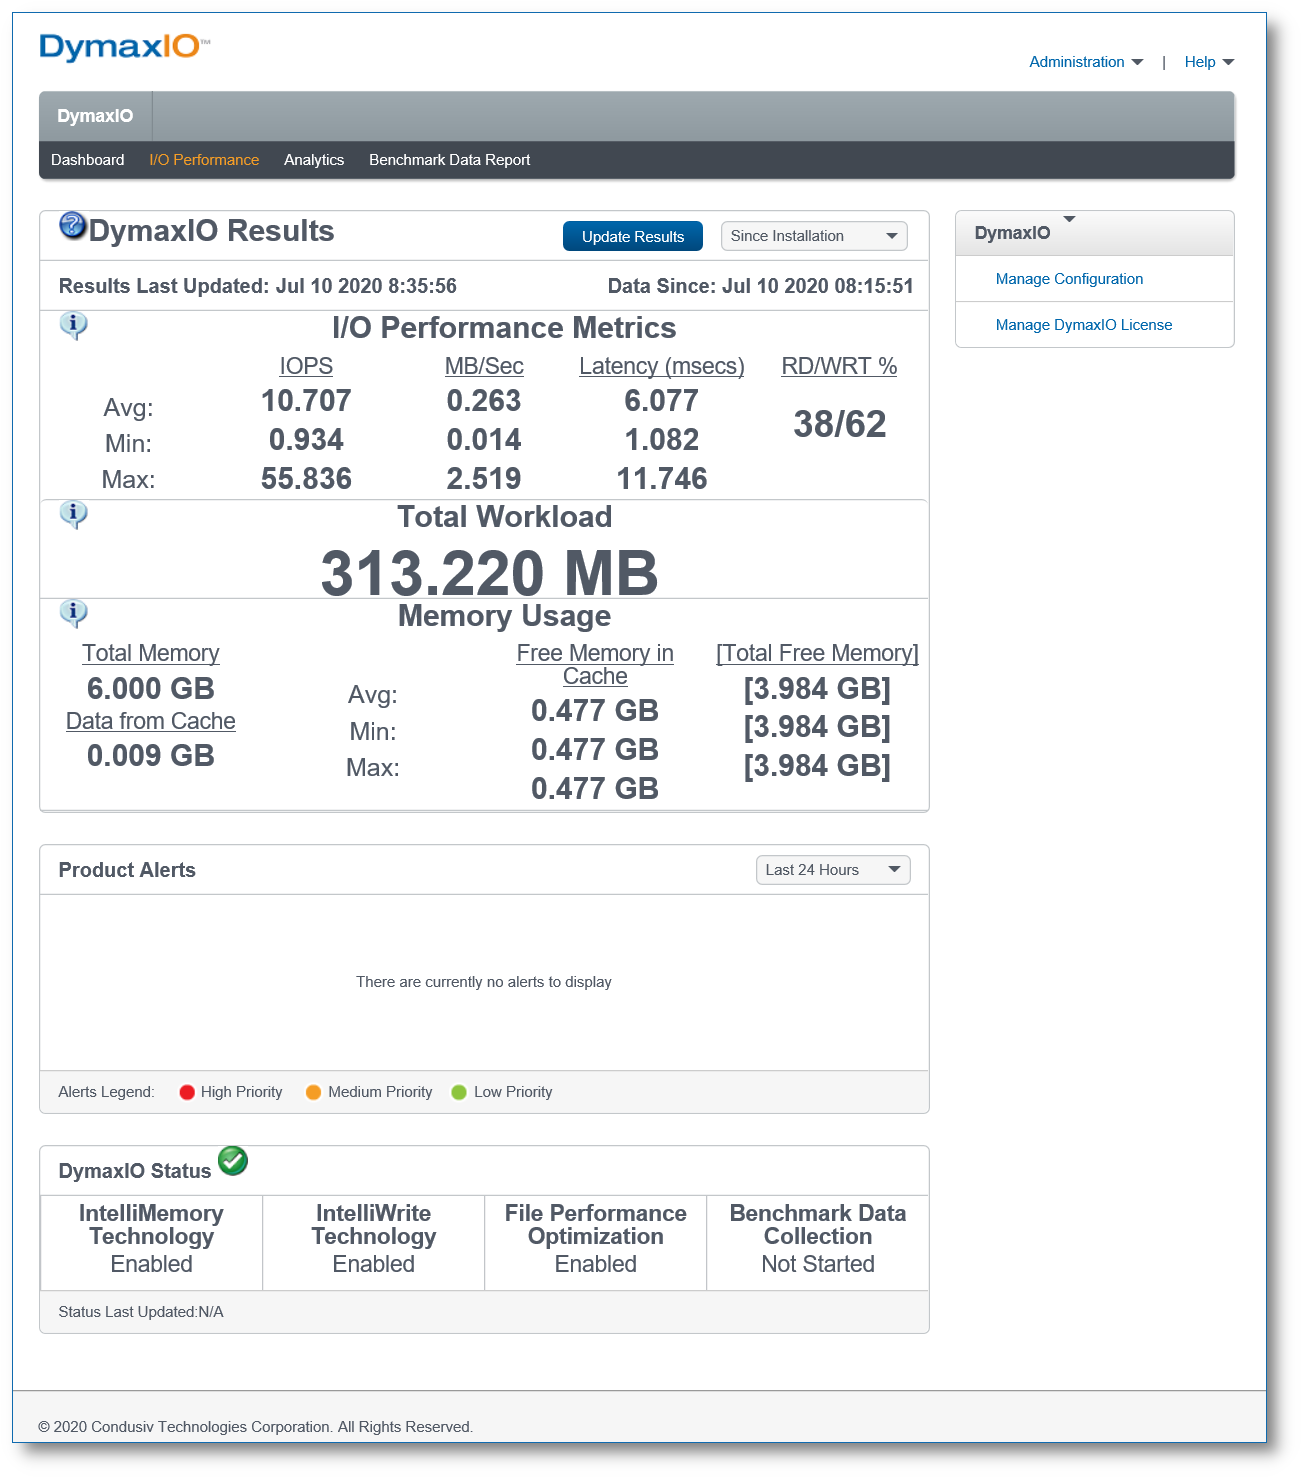
The I/O Performance link displays the following performance benefits in the DymaxIO Results section:
I/O Performance Metrics - The Average, Minimum, and Maximum values for the following three metrics:
I/Os Per Second (IOPS)
I/O Throughput in Megabytes per Second (MB/Sec)
I/O Latency in milliseconds (msecs)
As well as the average percentage of Read to Write I/Os (RD/WRT %)
Total Workload - The total amount of I/O that has been processed during the specified time frame, including data satisfied from cache.
Memory Usage - Memory usage during the specified time frame:
Total memory in the system, and the total amount of I/O data that has been satisfied from the IntelliMemory cache, is shown.
The average, minimum, and maximum values for free memory used by the cache are given. For each of these values, the corresponding total free memory in the system is shown (total free memory is memory used by the cache plus memory reported by the system as free).
The memory values will be displayed in red if the total memory is less than the 3MB minimum needed for DymaxIO caching to operate.

The User may hover over the information icons in the DymaxIO Results section to display a brief description of what each performance metric means. Clicking on the information icon will bring up the Help topic for that performance metric.
The Product Alerts section, DymaxIO Status section, and DymaxIO Quick Links pull-down menu are visible in this screen, and the Dashboard and Analytics screens.